Dashboard
The Dashboard is where you land. It is a set of widgets covering how much MBER has collected, how consistently it is collecting, and when the accounts being tracked actually post.
The numbers
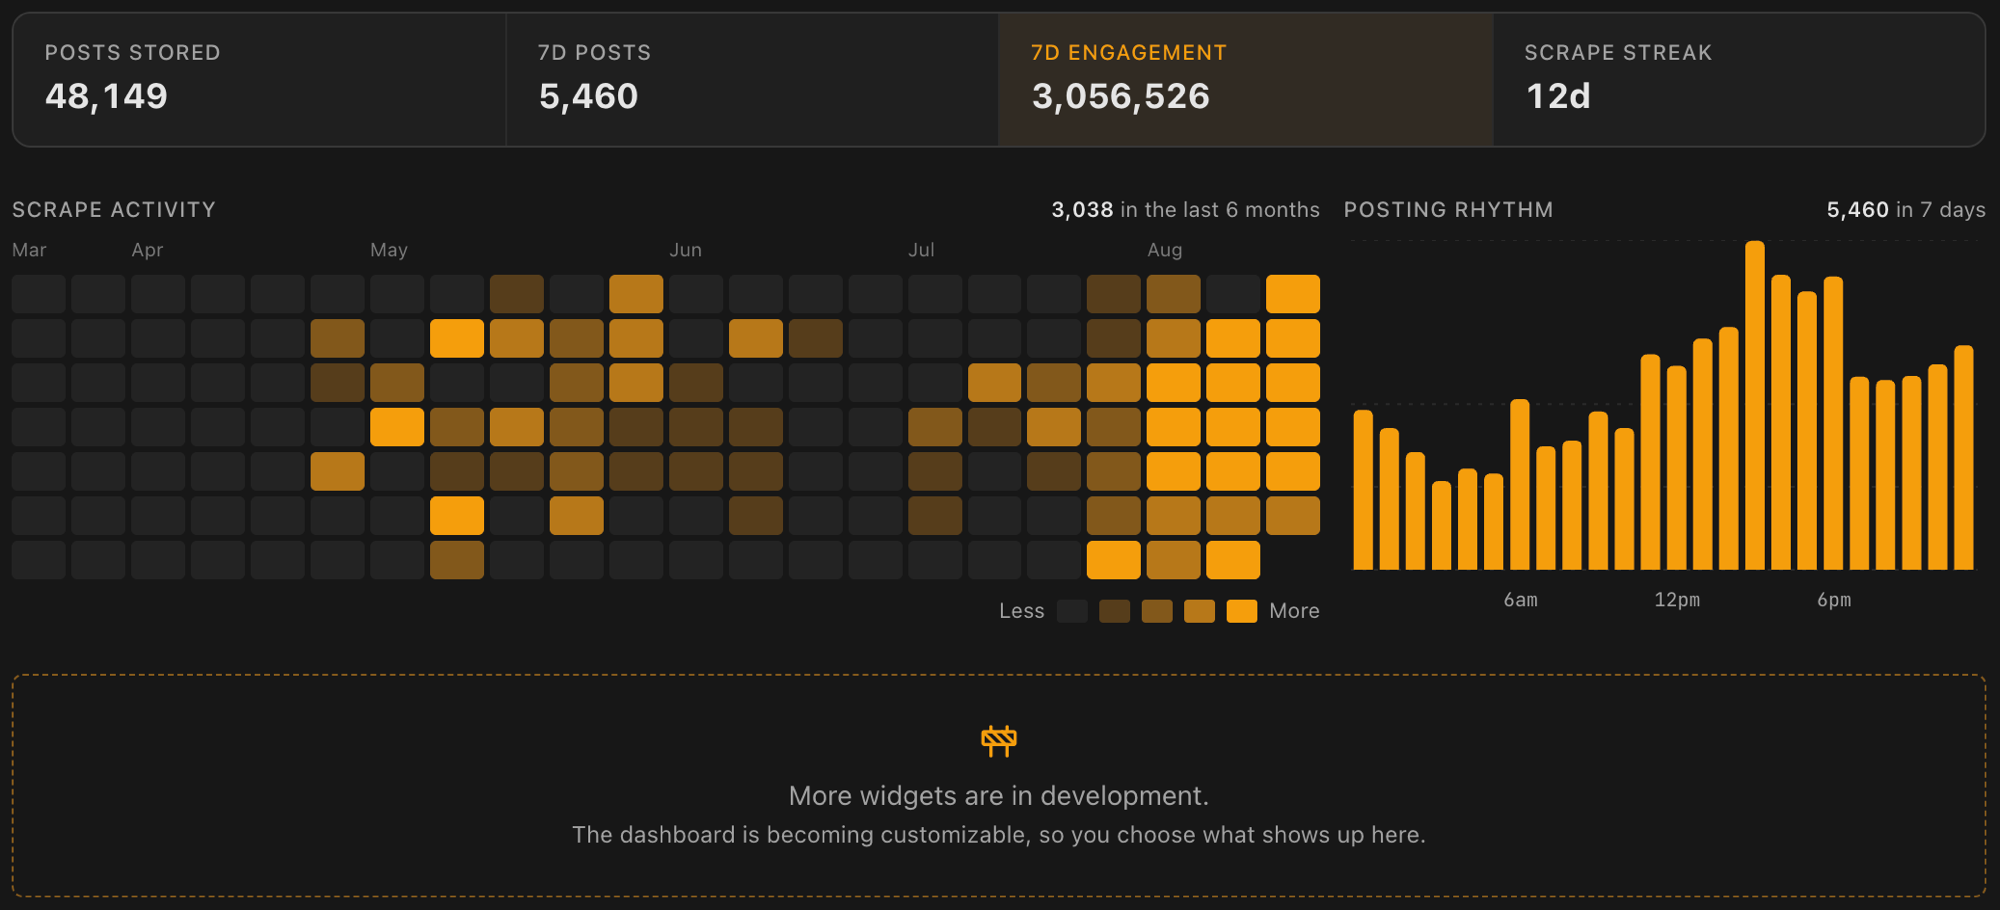
A strip of totals across the top:
| Stat | What it counts |
|---|---|
| Posts stored | Every post MBER currently holds. |
| 7d posts | Posts collected in the last seven days. |
| 7d engagement | Engagement across those posts. |
| Scrape streak | Consecutive days with at least one scrape. Today with no scrape yet does not break it. |
Scrape activity
A day-by-day grid of scraping across the last few months, darker where more ran. It is the quickest way to see whether collection has been steady or whether there is a gap, and the scrape streak next to it is read from the same data, so the two can never disagree. The Scraping engine page covers what a scrape actually does.
Posting rhythm
Post volume by hour of day across the tracked accounts, drawn as bars and shown in your local time. It answers a narrow but useful question: when is the feed you care about actually alive? That is the window worth being in.
The Dashboard is becoming customizable, so you will choose which widgets show up here. More are in development.